Cash Flows (The former Furukawa-Sky)
Consolidated Cash Flows
* Years ended March 31
(Millions of yen)
| 2009 | 2010 | 2011 | 2012 | 2013 | |
|---|---|---|---|---|---|
| Net cash provided by operating activities | 14,293 | 13,337 | 20,434 | 17,609 | 12,766 |
| Net cash used in investment activities | (12,391) | (12,509) | (7,070) | (21,083) | (15,198) |
| Net cash used in financing activities | (2,831) | (190) | 2,700 | (7,526) | (451) |
| Cash and cash equivalents, end of year | 3,465 | 4,111 | 20,115 | 11,339 | 9,023 |
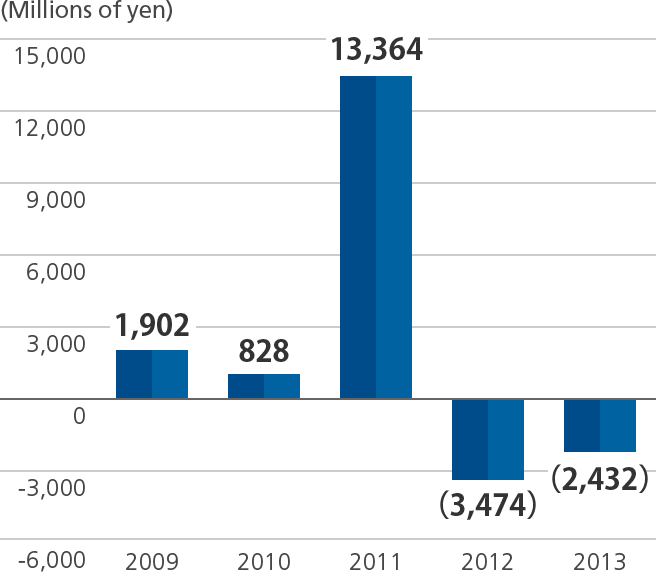
| Free cash flow* | 1,902 | 828 | 13,364 | (3,474) | (2,432) |
* Free cash flow = Net cash provided by operating activities + Net cash used in investment activities
Free cash flow


